20 Online Graph Maker for Creating Infographics
In this post, we looked at 20 convenient online graph maker and applications that you can use for making interesting data presentations such as infographics. As designers, we usually present technical and quantitative data containing numbers and symbols into beautiful charts and graphs to make them more interesting, less boring and easy-to-understand. This is because people are generally able to understand things from pictures quicker than from text or numbers.In creating maps, there are actually a number of online graph creator and resources where you can use to make graphs or charts easily without needing software or program to do it. Yes, you only need your web browser to create amazing graphs and charts.
ONLINE GRAPH MAKER APPLICATIONS TO TRY
To save you time from searching for online graph maker, we decided to list down some of the most useful online ones that you can use for free. These online graph maker applications are useful for creating workflow process scheme diagram, timeline presentations, objects references map, charts, house, room plans, among other things.
Google Chart Tools
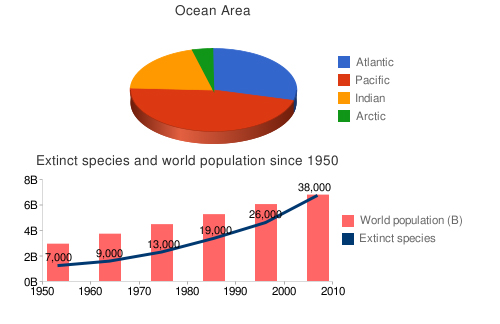
The Google Chart Tools enable adding live charts to any web page. Using these tools allow you to create a rich gallery of visualizations provided as image charts by using a simple URL request to a Google chart server or interactive charts using a Google developed JavaScript library. These tools are also able to read live data from a variety of data sources and most of all they are simple to use and free.
[ SOURCE ]
High Charts
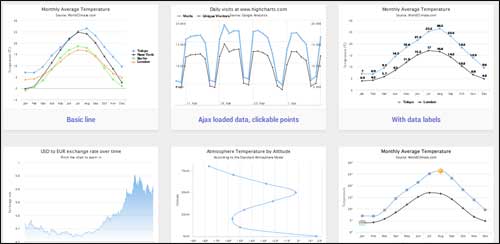
High charts is a charting library written in pure JavaScript, offering an easy way of adding interactive charts to your web site or web application. High charts currently supports line, spline, area, line, column, bar, pie and scatter chart types. This online graph maker works in all modern browsers including the iPhone and Internet Explorer from version 6. Standard browsers use the Canvas element and in some cases SVG for the graphics rendering. On Internet Explorer browser, these graphics are drawn using VML.
[ SOURCE ]
JS Charts
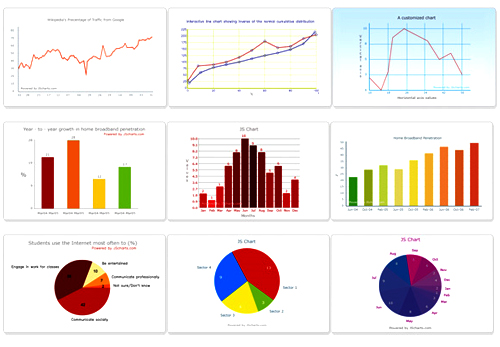
JS Charts is a JavaScript online graph maker that requires little or no coding. JS Charts allows you to easily create charts in different templates like bar charts, pie charts or simple line graphs. Moreover, JS Charts is free for non-commercial use.
[ SOURCE ]
Protovis
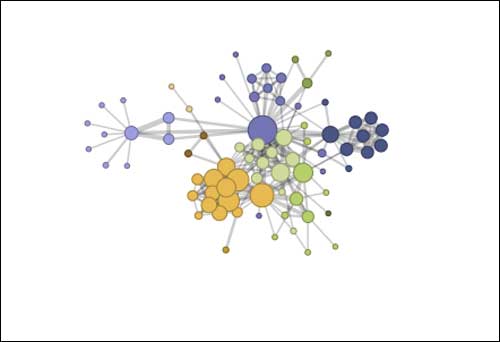
Protovis composes custom views of data with simple marks such as bars and dots. Unlike low-level graphics libraries that quickly become tedious for visualization, Protovis defines marks through dynamic properties that encode data, allowing inheritance, scales and layouts to simplify construction. Protovis is free and open-source, provided under the BSD License. This online graph maker uses JavaScript and SVG for web-native visualizations; no plugin required (though you will need a modern web browser)! Although programming experience is helpful, Protovis is mostly declarative and designed to be learned by example.
[ SOURCE ]
Milk Chart
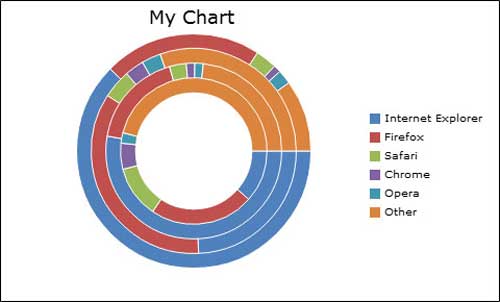
This online graph maker will generate a graph similar to Microsoft Excel. To transform a table of data into a chart, simply create a MilkChart object of the chart type you wish passing in the table id and an object containing options for the chart.
[ SOURCE ]
Tufte Graph
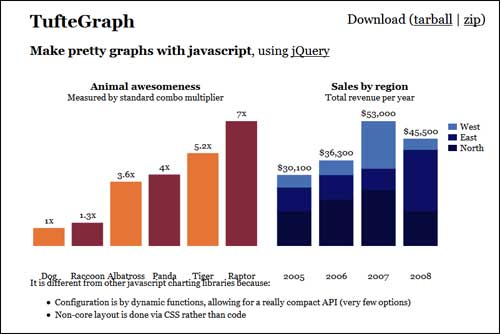
Tufte Graph allows you to make pretty graphs with javascript, using jQuery. It is different from other javascript charting libraries because its configuration is by dynamic functions, allowing for a really compact API (very few options). Also, the non-core layout is done via CSS rather than code.
[ SOURCE ]
MooChart
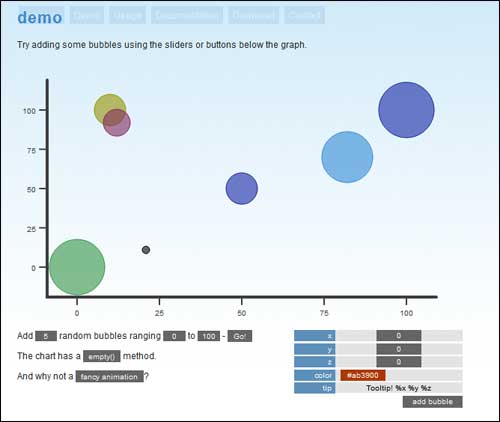
Moochart is a plugin for MooTools 1.2 that draws bubble diagrams on the canvas tag. Future versions might include pie, bar & line graphs. You can find all the other info like download details and demo on it’s single page.
[ SOURCE ]
Canvas 3D Graph
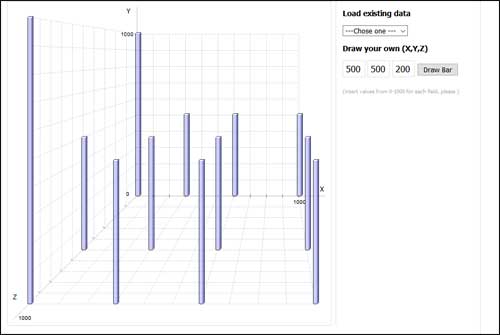
Canvas 3D Graph is a special type of bar graph that plot numbers in 3D. This first started as PHP-GD project, but soon I realized that there is not much sense in generating a complex graph like this on server side (script worked really fast, though). All the other details can be found on the information page itself.
[ SOURCE ]
CSS Stacked Bar Graphs
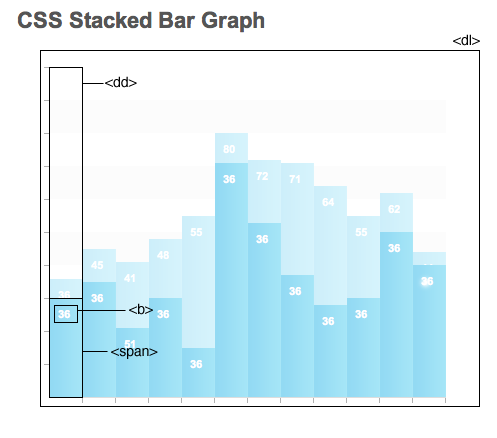
There are plenty of CSS bar graph interpretations, but none of them did stacked bar graphs. So here you can learn how to creat CSS Stacked Bar Graphs Based off Alen Grakalic’s Pure CSS Data Chart.
[ SOURCE ]
Origramy
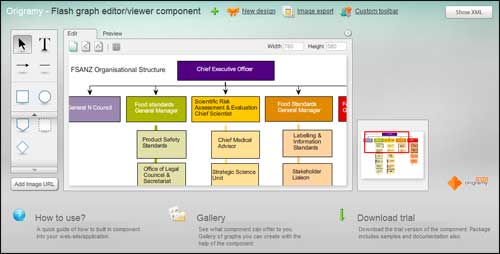
Origramy is a graph editor/viewer component. This online graph maker can be used to create complex graphs presentations, schemes, charts, save them and use the same component as a viewer. If you need to create a workflow process scheme, timeline presentation, specific diagram, objects references map, charts, house, room plans etc. – Origramy will help to create it fast and with ease. You can use the component later to view the data you combined. The component is based on Adobe Flash technology. That allows to demonstrate your graph in any browser on any platform.
[ SOURCE ]
FlyCharts
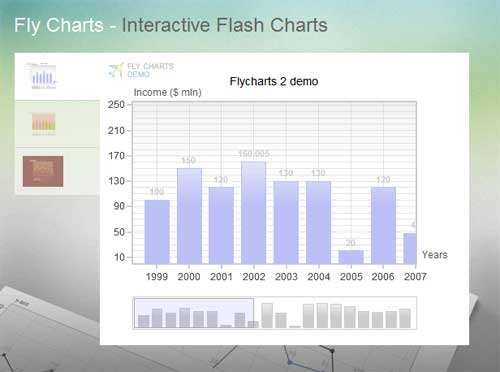
FlyCharts is a new version (2.0) of flash charts component. The second version brings you more ways to visualize your data, much more rich and customizable interface, fast and easy tuning of your component. And please note – it’s still free for private persons, still tiny and fast! Generally FlyCharts is a set of Adobe Flash (SWF) files that gives you outstanding possibility to visualize your data. Now, using FlyCharts you can create compact, interactive and good-looking charts in a minute. FlyCharts doesn’t need any installation, works with any scripting language, can be used in any browser, is interactive, is scalable & flexible, size of output files is really small. We have a number of chart types – column/bar, line/pipe, pie, area.
[ SOURCE ]
Chart Gizmo
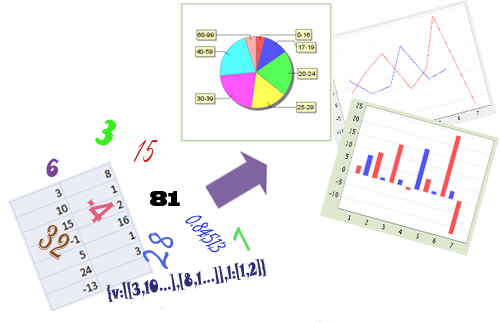
With your free account from ChartGizmo, you can now create charts for your website, blog and social network profiles. ChartGizmo may be useful for those who need to visualize financial, scientific or other type of data.
[ SOURCE ]
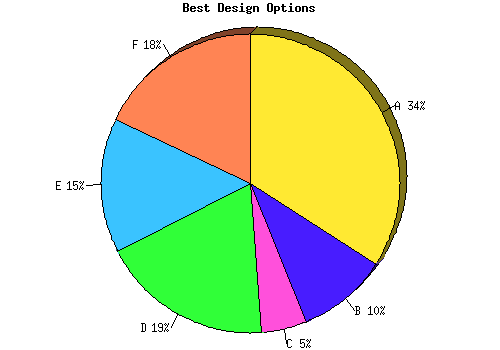
OWT Chart Generator
The OWT Chart Generator is an online graph maker tool. Click on one of the images below to choose the appropriate chart type, and then follow the instructions on the following page. A GIF image of the chart that you specified will be displayed on the screen.
[ SOURCE ]
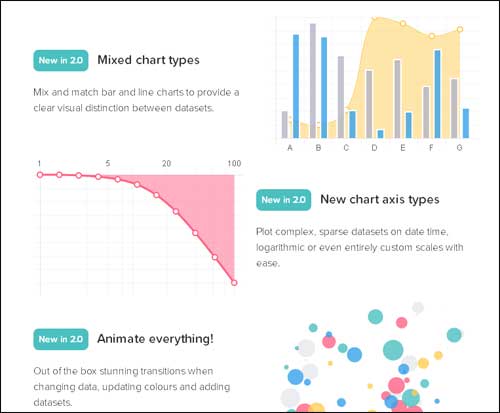
Chart.js
This online graph maker allows you to make simple yet flexible JavaScript charting. These are very useful for both web designers and developers.
[ SOURCE ]
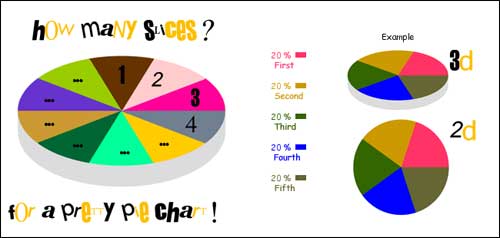
Pie Color
Pie color is a online graph maker tool that creates a pie chart with colors very easily.
[ SOURCE ]
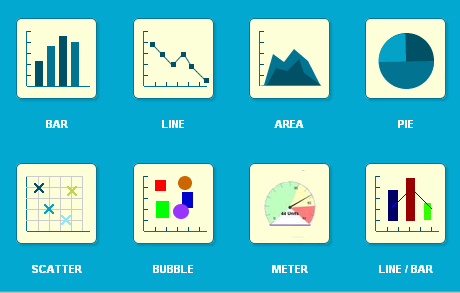
Chart Tool
Charts and graphs are a great tool because they communicate information visually. At Onlinecharttool.com, you can design and share your own graphs online and for free. This online graph maker supports a number of different chart types like: bar charts, pie charts, line charts, bubble charts and radar plots.
[ SOURCE ]
ChartGo
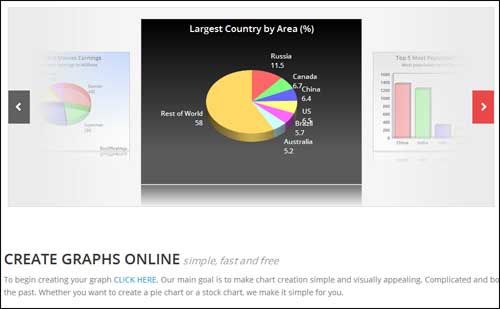
ChartGo allows users to create charts online quickly. Create bar charts, line charts or pie charts. Simply paste your data in the chart data area and hit the create chart button.
[ SOURCE ]
Hohli Charts
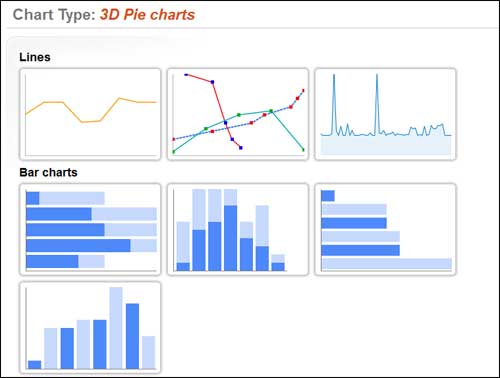
Hohli Charts lets you dynamically generate any kind of charts from pie to bar to line charts, easily.
[ SOURCE ]
Vertical Bar Graphs with CSS and PHP
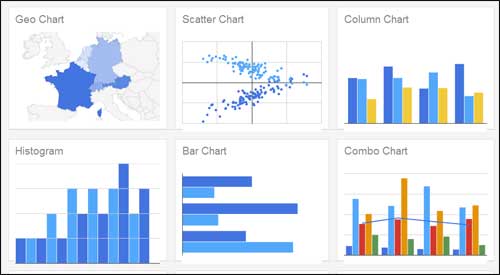
Who wants to use Excel to make a new graph each week? Using CSS and PHP you can create attractive bar graphs (yes, even the stacked kind) that are always up to date.
[ SOURCE ]
Swiff Chart Generator
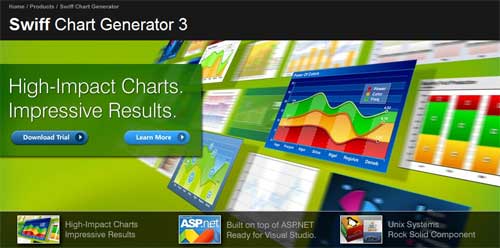
Dynamically serve eye-catching animated charts with ASP.NET, PHP and JSP. Query data from a database, apply your own style template created with the Swiff Chart authoring tool and instantly generate high-impact charts in Adobe Flash™ format, PNG/JPG format and SVG/PDF format. Available on Windows and Unix systems.
[ SOURCE ]

