21 Interesting Examples of Chart Designs and Graphs
Looking for examples of eye-catching chart designs? If yes, then you have landed on the right page. In this post, therefore, we put together 21 very attractive and visually appealing charts and graphs examples that you can use as inspiration in creating your own data visualization. The examples include pie charts, bar graphs, infographics, and a few tutorials that you can follow in case you have no idea how to come up with your own charts.
Graphs and chart designs are often used to give a visual representation of data, especially for publications like Annual Reports or in slide and Powerpoint presentations. Through chart and graphs, you can easily provide your readers or viewers with facts about certain patterns, trends, and future outcomes. Also, most people find it easier to understand and analyze data and figures when plotted into charts and graphs such as pie graphs, line charts, bar graphs, among others.
To know more about each graph or chart and view it in a larger format, simply follow the link provided below each preview image. We hope you will find these chart and graphs examples inspiring as well. Have fun!
21 CHART DESIGNS AND GRAPH EXAMPLES
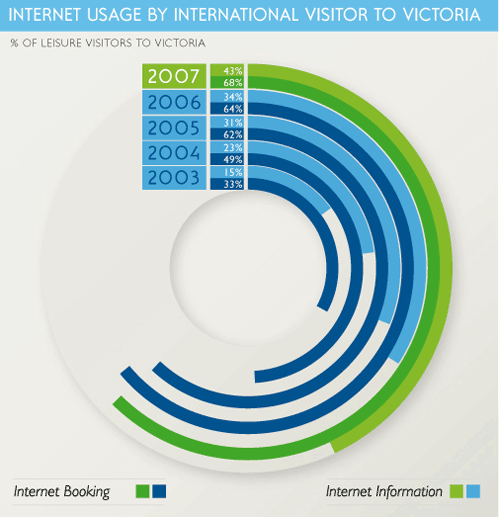
01. Tourism Victoria Annual Report 2008 – Graphs
[ SOURCE ]
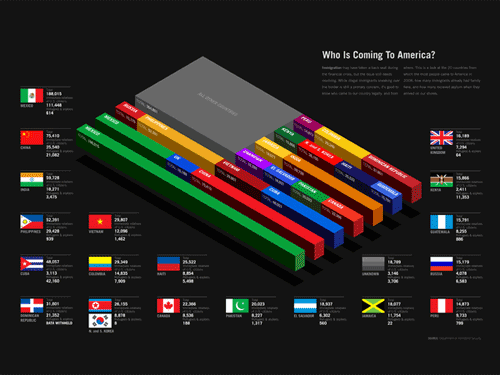
02. Who is Coming to America by Good Magazine
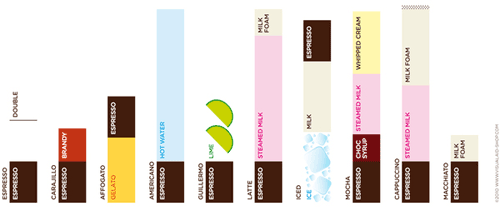
03. ‘Know It All’ Coffee Mug
This graph shows the formulas of ten of the best coffees going, with a visual breakdown of ratios of coffee to milk and other, sometimes unexpected, ingredients. Helping you to create the most perfect, or most bonkers, a cup of coffee.
[ SOURCE ]
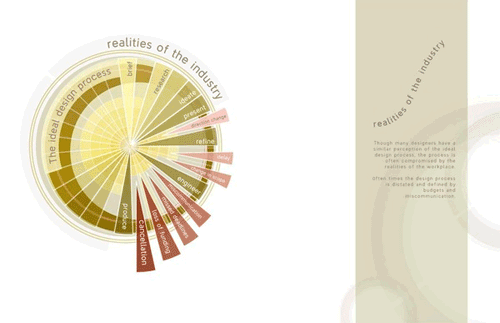
04. Realities of the Industry
An information visualization exercises exploring the ideal design process and the disruptions that hinder it.
[ SOURCE ]
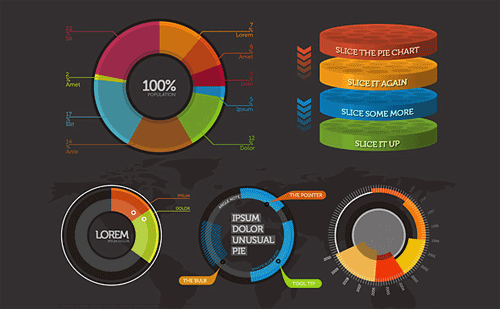
05. The world: infographic elements template
This PSD file Includes dozens of professional chart designs, graphic elements, great for any design you need, such as presentations, websites, ads, brochures, posters, etc.
[ SOURCE ]
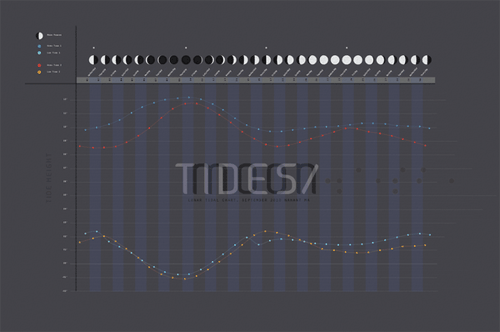
06. Lunar Tides & Moon
A three-dimensional piece to demonstrate a concept using reflected light, cast shadows, and rhythmic flow.
[ SOURCE ]
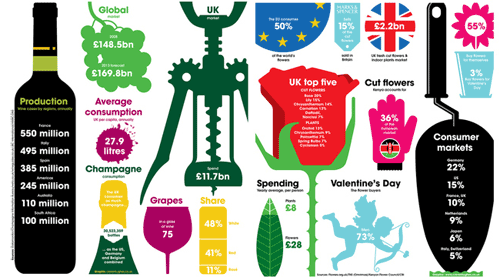
07. Infographics for British Airways
[ SOURCE ]
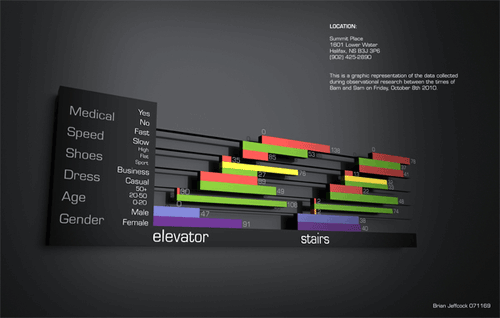
08. Staircase Users
This is an infographic created using some raw data collected from watching people use a staircase in an office building. The project is to study staircase users and try to improve the experience in an attempt to get more people using the staircases in office buildings.
[ SOURCE ]
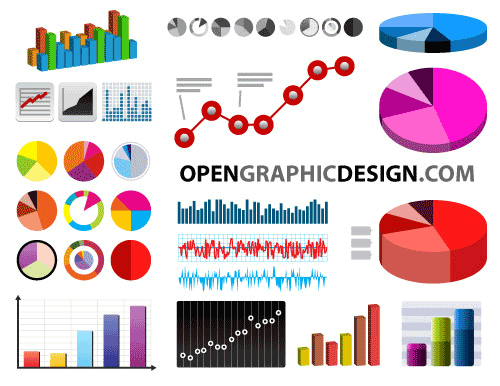
09. Charts and Graphs in Vector Format
This set contains various colorful chart designs in vector format. Some samples include pie graphs, bar graphs, circle graphs, line charts, and other statistical graphs. If you’re collecting visitor information on your website, you have probably seen various analytic graphs used.
[ SOURCE ]
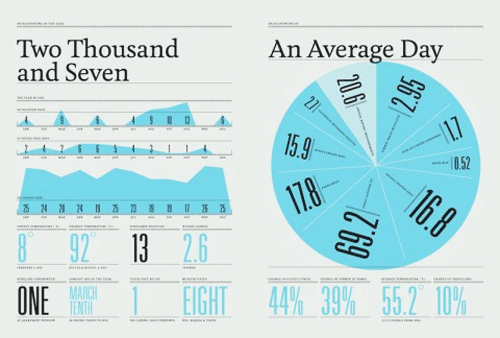
10. The Feltron 2007 Annual Report
You can draw some inspiration from this minimalist chart designs from an annual report.
[ SOURCE ]
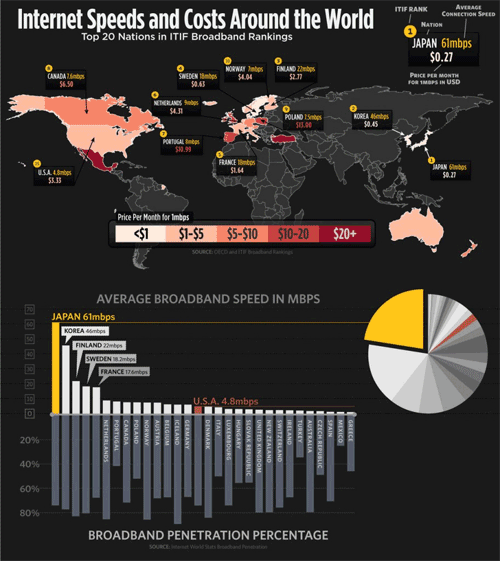
11. Internet Speed and Cost Around the World
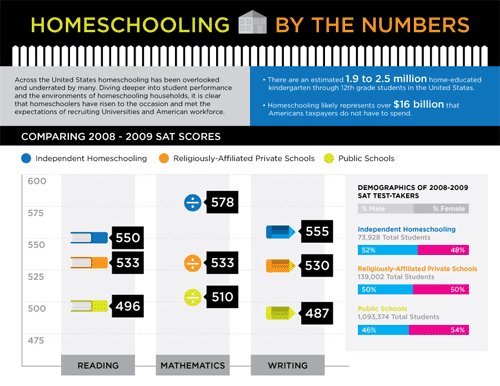
12. Home Schooling by the Numbers
[ SOURCE ]
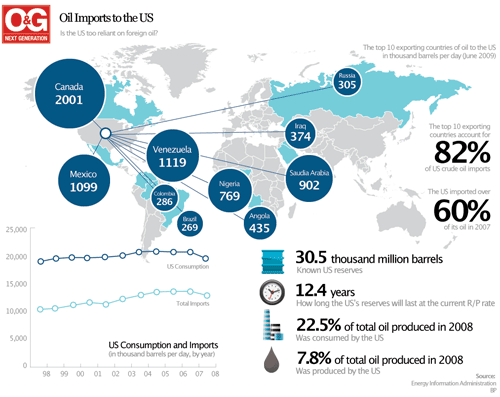
13. Oil Imports to the US
This chart shows how reliant is the US on foreign oil.
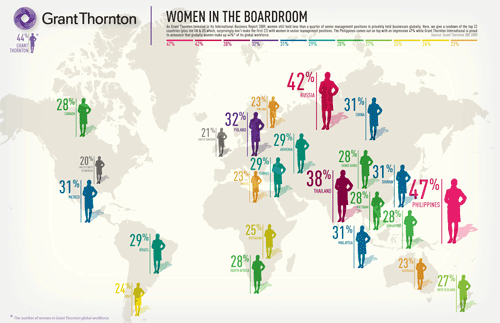
14. Women in the Boardroom
Women still hold less than a quarter of senior management positions in privately held business globally.
[ SOURCE ]
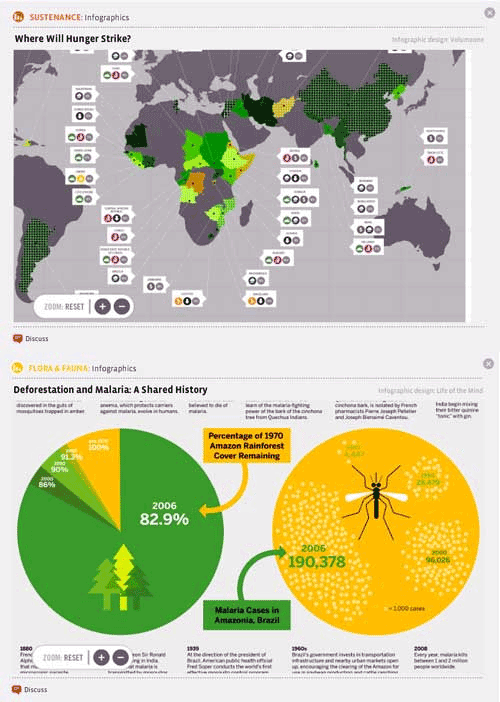
15. Hunger and Malaria
[ SOURCE ]
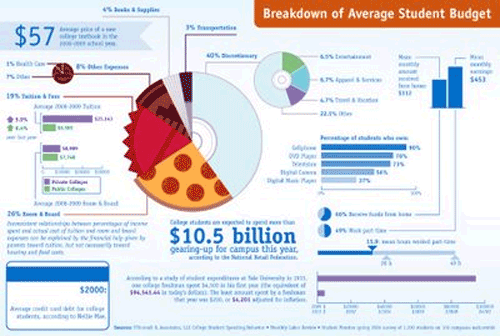
16. Breakdown of Average Student Budget
[ SOURCE ]
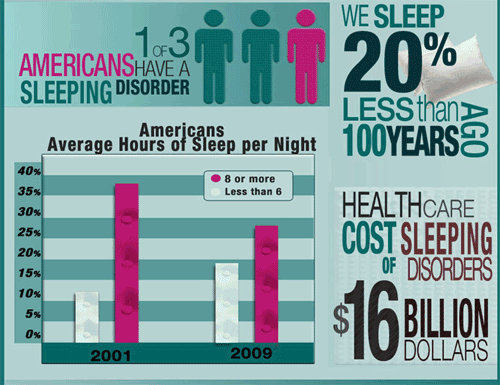
17. Find Your New Mattress
Mattress choices vary for levels of comfort, style, and quality. Coast to Coast has some of the finest in well-crafted mattresses available. Which one of these mattresses is the right mattress for you?
[ SOURCE ]
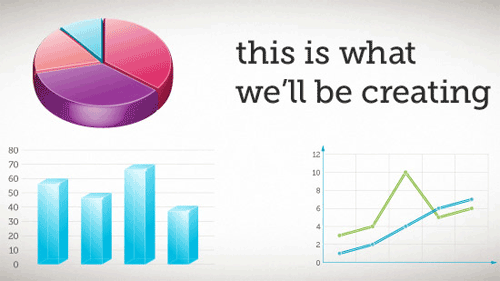
18. Adobe Illustrator Tutorial for Creating Charts and Graphs
Create your very own eye-catching chart designs and graphs with this easy-to-follow tutorial.
[ SOURCE ]
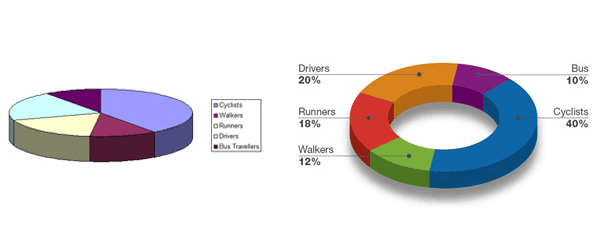
19. Create a simple 3D Pie Graph using Illustrator CS5
This tutorial lets you create a simple print-ready 3D pie graph seen in many corporate or annual reports.
[ SOURCE ]
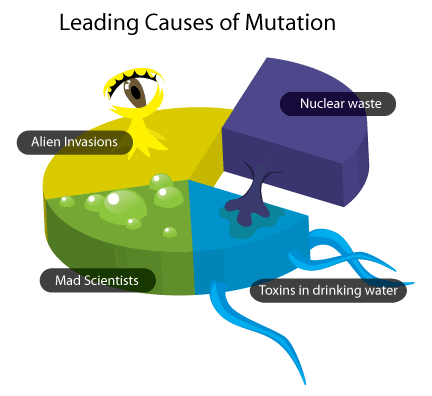
20. Spice up Pie Charts
For some chart designs, you might only want to spice up the most important slice or the biggest one. Although most topics aren’t as fun as mutations, any sort of added graphics makes boring charts look a lot better.
[ SOURCE ]


