Infographic Maker: 51 Free Tools You Can Use Online
Are you looking for an infographic maker online? Creating infographics requires tremendous analytical and creative skills plus the ability to convert these data and information into interesting visuals. The good news is, there are available resources online that you can use to help you create infographics. In this post, we will list down all available infographic maker tools and resources that you can use to simplify the process of creating infographics.
Telling your story in visual form through the use of infographics has been one of the hottest trends in recent times. Given the tremendous information available online, people are now more interested to get information through colorful and interesting graphics, instead of words and numbers.
Meanwhile, if you need inspiration for creating infographics, visit our roundup of infographic examples from around the web.
ONLINE INFOGRAPHIC MAKER TOOLS AND RESOURCES
I. Infographic Maker: Data Visualization Tools and Applications
These are online infographic maker applications that you can use to generate charts, graphs and tables. These applications offer you with many options such as style of graphs and charts, color schemes, and other visual styles.
AmCharts
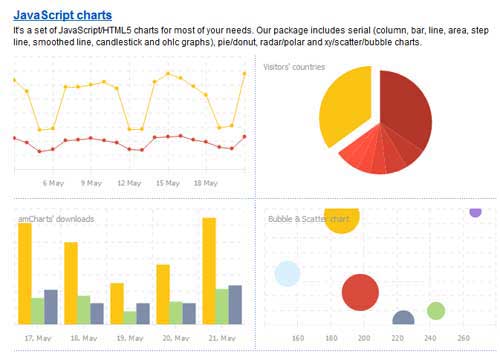
A set of free JavaScript/HTML5-based chart tools that can cover most of your needs, whether designing static infographics or developing “live” dynamic charts that you can embed in your designs. You can choose from different chart types from serial (column, bar, line, area, step line, smoothed line, candlestick), to pie or doughnut, to radar or bubble charts and a lot more.
[ SOURCE ]
Bubbl.us
A free online infographic maker brainstorming tool that lets you easily build colorful mind maps to print or share with others. You may also print or copy screenshots of your creations so you can incorporate them into infographics, presentations and other content!
[ SOURCE ]
Cacoo
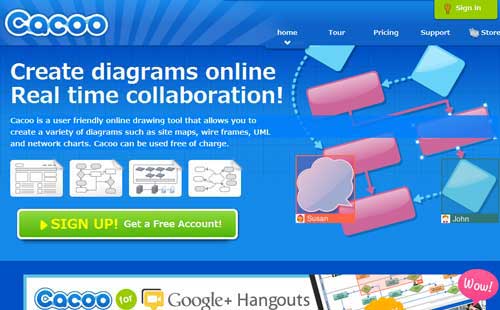
A user-friendly online infographic maker drawing tool that allows you to create a variety of diagrams such as site maps, wire frames, UML and network charts. Cacoo can be used free of charge.
[ SOURCE ]
Chartle (Beta)
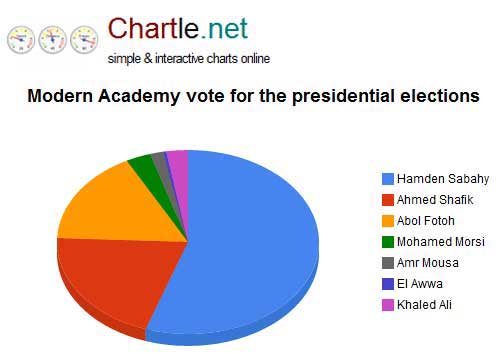
Simple, browser-based infographic maker tool for creating slick-looking charts and graphs easily using a variety of ready-to-use templates like US Map, Venn Diagram, and many others.
[ SOURCE ]
ChartsBin
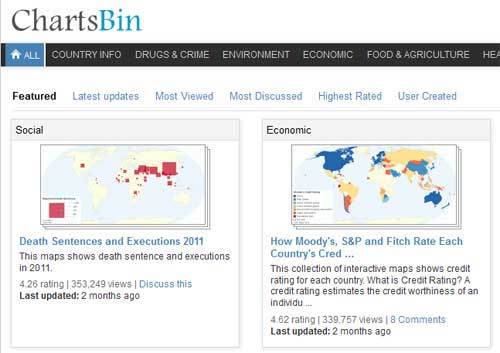
A web-based infographic maker that acts as data visualization tool. It allows everyone to quickly and easily create rich interactive visualizations with their own data. You can then share your interactive visualizations with others by embedding them in websites, blogs or sharing via Facebook or Twitter.
[ SOURCE ]
Creately
Create interesting charts and diagrams quickly and collaboratively. This site has an extensive library of object sets and ready-made templates to make things easy. It also offers both free and paid (but very affordable) versions to cover your needs.
[ SOURCE ]
Easel.ly
Here is an amazing new web-based infographic maker tool that allows users to create beautiful infographics using a drag and drop menus with tons of pre-loaded content and lots of great themes that you can edit and manipulate to look however you want.
[ SOURCE ]
D3.js
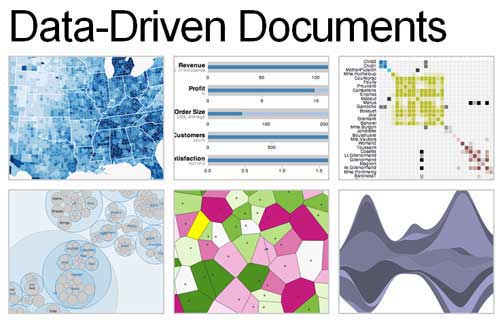
A JavaScript library for manipulating documents based on data. D3 helps you bring data to life using HTML, SVG and CSS. Its emphasis on web standards gives you the full capabilities of modern browsers without tying yourself to a proprietary framework, combining powerful visualization components and a data-driven approach to DOM manipulation.
[ SOURCE ]
Degrafa
A declarative graphics framework for creating rich user interfaces, data visualization, mapping, graphics editing and more.
[ SOURCE ]
Dundas
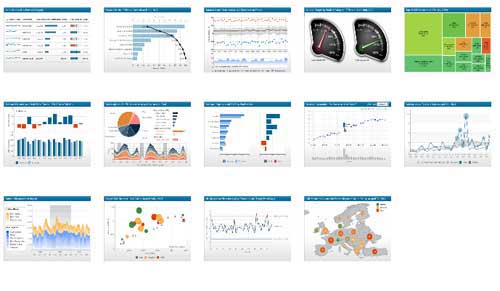
Dundas has a wide range of infographic maker tools such as data visualization solutions for Microsoft technologies. They offer a number of data visualization tools including: Chart, Gauge, Map and Calendar for .net and Dashboards for Silverlight.
[ SOURCE ]
Flare
An ActionScript library for creating visualizations that run in the Adobe Flash Player. From basic charts and graphs to complex interactive graphics, the toolkit supports data management, visual encoding, animation, and interaction techniques. Even better, flare features a modular design that lets developers create customized visualization techniques without having to reinvent the wheel.
[ SOURCE ]
Free Vector Infographic Kit
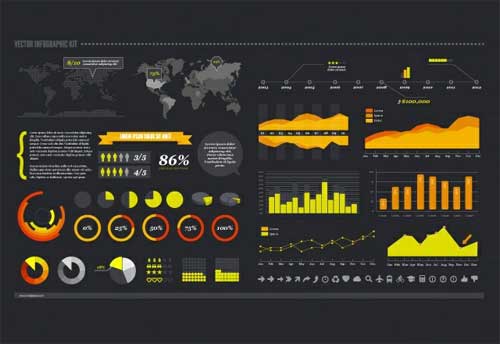
A huge vector set for creating infographics. Included in the package are over 50 elements, ranging from graphs and charts to maps and symbols.
[ SOURCE ]
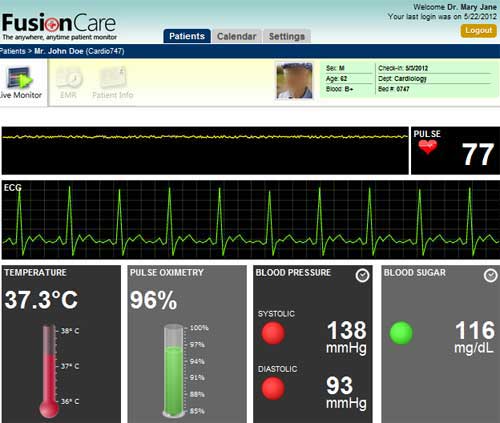
FusionCharts Suite
Offers over 90 chart types and 550 maps in JavaScript (HTML5) and Flash formats.
[ SOURCE ]
Gephi
Gephi is an interactive infographic maker tool for visualization and exploration platform. It is applicable for all kinds of networks and complex systems, dynamic and hierarchical graphs.It runs on Windows, Linux and Mac OS X. Gephi is open-source and free.
[ SOURCE ]
GeoCommons
GeoCommons enables everyone to find, use and share geographic data and maps. Easily create rich interactive visualizations to solve problems without any experience using traditional mapping tools.
[ SOURCE ]
Gliffy
An online diagramming service that helps users communicate with a combination of shapes, text, and lines. It’s easy to use. Just drag-and-drop shapes from an extensive library and point-and-click your way to format. No expertise needed.
[ SOURCE ]
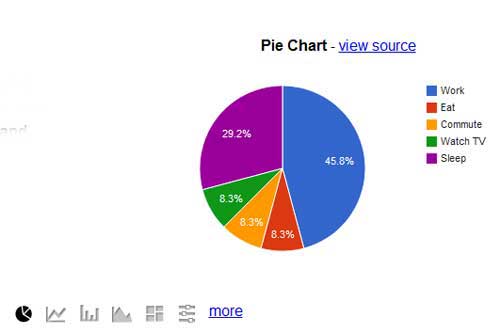
Google Chart
Google chart infographic maker tools are powerful, simple to use, and free. Choose from a variety of charts. From simple scatter plots to heirarchial treemaps, find the best fit for your data.
[ SOURCE ]
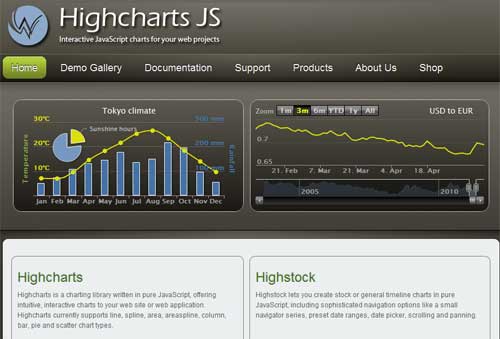
Highcharts
A charting library written in pure JavaScript, offering intuitive, interactive charts to your web site or web application. This application currently supports line, spline, area, area spline, column, bar, pie and scatter chart types.
[ SOURCE ]
Hohli Charts
Using the Hohli Online Charts Builder you can create bar graphs, line graphs, pie charts, Venn diagrams, scatter plots, and radar charts. To create your chart first select the type and size of display that you desire. Then fill in the corresponding form with the information that you want displayed. Your chart will be generated as you enter information so that you can see how each piece of information influences the chart
[ SOURCE ]
iCharts
A cloud-based company that makes it easy to visualize, share and distribute Big and Small data. It envisions is to empower the world to explore and share data by enabling the free flow of visual data among data owners, media, business and consumers.
[ SOURCE ]
Infogr.am
Using Infogr.am is like using Adobe Illustrator online to create cool infographics. Simply pick the design you want, add your data and share or embed your infographic.
[ SOURCE ]
InfoVis Toolkit
It provides tools for creating Interactive Data Visualizations for the Web using JavaScript. The toolkit implements advanced features of information visualization like TreeMaps, an adapted visualization of trees based on the SpaceTree, a focus+context technique to plot Hyperbolic Trees, a radial layout of trees with advanced animations -called RGraph and other visualizations.
[ SOURCE ]
JS Charts
A JavaScript-based chart generator that requires little or no coding. With JS Charts drawing charts is a simple and easy task, since you only have to use client-side scripting (i.e. performed by your web browser). No additional plugins or server modules are required. Just include our scripts, prepare your chart data in XML, JSON or JavaScript Array and your chart is ready.
[ SOURCE ]
Kinzaa
This infographic maker application lets you build visually stunning infographic resumes.
[ SOURCE ]
Many Eyes
A data visualization site that offers tools for creating your own visualizations as well as for browsing infographics created by others. There are already thousands of visualizations included on the site.
[ SOURCE ]
Mind 42
A browser-based collaborative mind-mapping tool. It helps you manage your ideas, visualize your brainstorms, and screenshot your creations adding well-organized, text simplicity into your infographics.
[ SOURCE ]
Mindomo
An online mind mapping software that lets you create attractive collaborative visualizations of your thoughts and ideas.
[ SOURCE ]
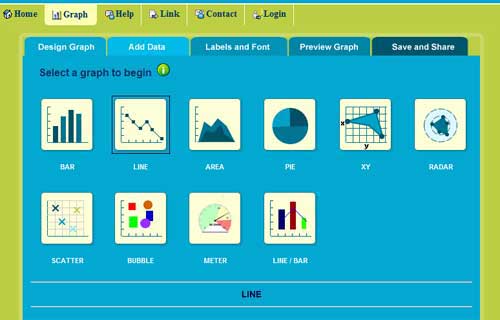
Online Charts
At Onlinecharttool.com, you can design and share your own graphs online and for free. This infographic maker application supports a number of different chart types like bar charts, pie charts, line charts, bubble charts and radar plots.
[ SOURCE ]
PiktoCharts
Information is supposed to be fun and exciting, not dull and boring. If you agree to this, then try PiktoChart, a web application for creating fun infographics.
[ SOURCE ]
Prefuse
A set of software tools for creating rich interactive data visualizations. The original prefuse toolkit provides a visualization framework for the Java programming language. The prefuse flare toolkit provides visualization and animation tools for ActionScript and the Adobe Flash Player.
[ SOURCE ]
Re.vu
Are you thinking of creating a resume through infographics? Try Re.vu, an application for creating visual résumé.

[ SOURCE ]
Stat Silk
Offers a range of web-based and desktop software to cater to diverse visualization needs. Award-winning suite of products that includes StatPlanet, StatTrends & StatWorld.
[ SOURCE ]
Tagxedo
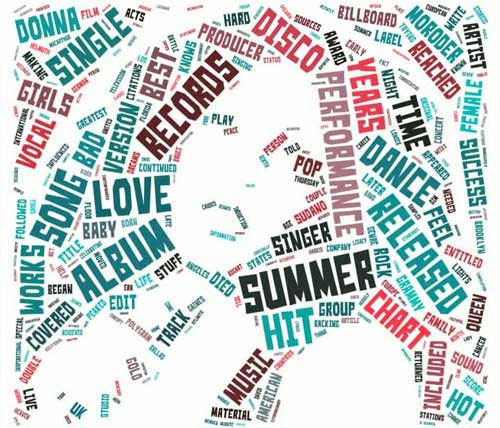
Use tagxedo to turn words — famous speeches, news articles, slogans and themes, even your love letters — into a visually stunning word cloud. Words are individually sized appropriately to highlight the frequencies of occurrence within the body of text.
[ SOURCE ]
Tableu Public
This free data visualization tool can help you create an interactive visuals and embed it in your website or share it. Anyone can do it, it’s that easy—and it’s free.
[ SOURCE ]
Weave
A new web-based visualization platform designed to enable visualization of any available data by anyone for any purpose. Weave is an application development platform supporting multiple levels of user proficiency – novice to advanced – as well as the ability to integrate, disseminate and visualize data at “nested” levels of geography.
[ SOURCE ]
VIDI
A suite of powerful Drupal visualization modules.VIDI gives you easy-to-use tools to build and embed colorful and dynamic maps for your presentations or your blogs. It includes powerful and intuitive tools for expressing data through maps.
[ SOURCE ]
Visualize Free
If you are looking for a way to visually explore and present data that standard office charting software cannot handle, Visualize Free is for you. This is a free visual analysis tool that’s perfect for sifting through multi-dimensional data to spot trends and aberrations or slice and dice data with simple point-and-click methods.
[ SOURCE ]
Visualize.me
Convert your LinkedIn profile into a beautiful infographic in one click. This online application can automatically translate your data from LinkedIn and formats it in a clean, crisp, and easy to read visual resume.
[ SOURCE ]
Wordle
An application for generating “word clouds” from text that you provide. The clouds give greater prominence to words that appear more frequently in the source text. You can tweak your clouds with different fonts, layouts, and color schemes. The images you create with Wordle are yours to use however you like. You can print them out, or save them to the Wordle gallery to share with your friends.
A huge vector set for creating infographics. Included in the package are over 50 elements, ranging from graphs and charts to maps and symbols.

[ SOURCE ]
II. Infographic Maker: Data Sources
Data 360
A treasure trove of useful, up-to-date data for incorporating into your infographics. Covers a wide range of topics, including Economy, Societal Trends, Energy, Environment and data by Country. If you’re looking data and statistics, start here!
[ SOURCE ]
DataMarket
Explore data sets from the most important data providers, upload your own data, build reports and create beautiful visualizations in seconds.
[ SOURCE ]
EveryBlock
All the news and talk from your neighborhood. Finally in one place.
[ SOURCE ]
Freebase
An entity graph of people, places and things, built by a community that loves open data.
[ SOURCE ]
Gapminder
Also a great source of data for infographics. A “fact tank” that promotes a fact-based world view, here you will find updated statistical content, videos, Flash presentations, and charts showing major global development trends with animated statistics and colorful graphics.
[ SOURCE ]
Get the Data
Ask and answer data related questions.
[ SOURCE ]
Google Public Data Explorer
If you need a very specific data for your infographics, Google Public Data Explorer may be just the answer to that. This Google tool presents interactive charts of public data that you can explore, manipulate and screenshot for developing rich, informative infographics. Use the built-in search function to find information about specific topics.
[ SOURCE ]
Knoema
Knoema is a knowledge platform for connecting data with analytical and presentation tools.
[ SOURCE ]
Number of
You ask, we count. This is another great source of data for your infographics. The topic covers anything under the sun.
[ SOURCE ]
Visualizing.org
A massive collection of rich data sets and beautiful, well-organized infographics from all over the web. This site is also a source for inspiration with a massive collection of beautiful infographic examples.
[ SOURCE ]
WorldMap
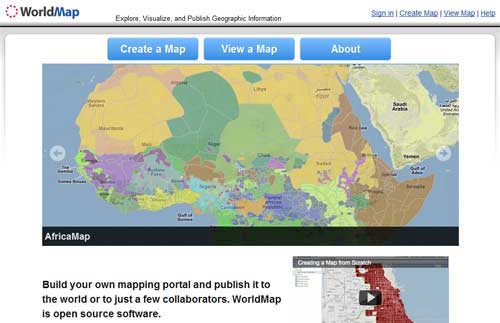
An open source software that lets you build your own mapping portal and publish it to the world or to just a few collaborators. It offers over 90 chart types and 550 maps in JavaScript (HTML5) and Flash formats.
[ SOURCE ]

